


Top 10 Key Performance Indicators (KPIs) for Every Business
Every decision count in the fast-moving, complex market of today. In an era when data can be so illuminating, especially white spaces, business leaders can no longer afford to make decisions based solely on gut feeling.
And that brings us to the concept of Key Performance Indicators (KPIs). They serve as quantifiable indicators that enable organizations to monitor progress, assess strategies, and align performance with business goals.
But if you are a startup measuring growth or an established corporation working on efficiency knowing which KPIs matter most can be the difference.
The following blog offers you the 10 most common KPI examples in any type of business, how they reflect on performance, and how they should be present in your decision-making toolbox in 2025.
Why KPIs Matter in Business
KPIs are not just mere numerous; they are nothing less than a GPS for the business leaders to go the right way. Deloitte reports that organizations that use KPIs effectively are five times more able to make decisions that enhance profitability in time.
KPIs go beyond this; they also make it possible to predict problems before they turn into crises.
Suppose you own a digital marketing agency. If you never track conversion rates or customer acquisition costs, you wouldn’t know whether your campaigns are returning capital or burning it.
Likewise, in a way of life, without monitoring minutes, production bottlenecks may scream quietly round losses.
The Top 10 KPI Examples Every Business Should Track
Here are the most important KPIs any business in any industry can implement.
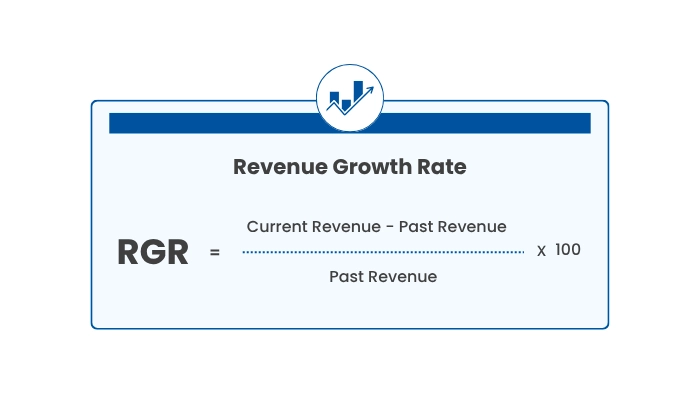
1. Revenue Growth Rate
This KPI indicates how much revenue your company is scaling with time. It is important for investors and stakeholders as it indicates overall business health.
Formula: ((Current Revenue – Past Revenue) ÷ Past Revenue) × 100
2. Net Profit Margin
Profitability defines sustainability. Net profit margin shows how much of every dollar you make is really profit.
Calculation: (Net profit / Total Revenue) × 100
3. Customer Acquisition Cost (CAC)
When you have the new customer acquisition cost in mind, you can optimally price your business marketing spend & sales revenue. Too high CAC compared to CLV you lose money.
4. Customer Lifetime Value (CLV)
This metric predicts the net profit that a company will generate through the entire business relationship with a customer. If your CLV is high, it means you have great retention methods.
5. Churn Rate
The number of customer churned, over a specific duration. High churn means unhappy or disengaged customers.
6. Employee Productivity Rate
Business outcomes are also heavily impacted by employee performance. By comparing output to input, it shows where the organization is working well and where workforce optimization is needed.
7. Inventory Turnover
This KPI is of utmost importance specifically to retail and e-commerce, as it indicates how frequently the entire stock within the store is sold and replaced during a specific period. A high rate of inventory turnover means that stocks are quickly disposed of.
8. Conversion Rate
If you have a business online, then the secret is simple: your conversion rate is the king. It explains how many of the visitor’s become customers and is an indication of the effectiveness of the marketing.
9. Operating Cash Flow
Cash flow really is the lifeblood of business. This KPI allows to ensure that operations come up with enough liquidity for expenses and investments.
10. Net Promoter Score (NPS)
NPS offers one simple question to customers to determine their loyalty and satisfaction levels: “On a scale of 0 to 10, how likely are you to recommend us to a friend or colleague? This means a high NPS is a sign of genuine brand advocacy.
KPI Comparison Table for Quick Reference
KPI | Purpose | Formula / Measurement | Why It Matters |
Revenue Growth Rate | Tracks business expansion | (Current – Past Revenue) ÷ Past Revenue | Shows long-term financial health |
Net Profit Margin | Measures profitability | Net Profit ÷ Total Revenue | Ensures financial sustainability |
CAC | Customer Acquisition Cost (CAC) | New Customers = Total Sales & Marketing Spend / New Customers | Balances growth with cost efficiency |
CLV | Value of a customer over lifetime | Average Purchase × Frequency × Duration | Encourages focus on retention |
Churn Rate | Customer loss percentage | Percentage of customers lost = (Lost Customers ÷ Total Customers) × 100 | Highlights customer satisfaction gaps |
Employee Productivity | Workforce performance | Output ÷ Input | Drives HR and operational strategies |
Inventory Turnover | Efficiency in stock management | COGS ÷ Average Inventory | Reduces holding costs, improves sales flow |
Conversion Rate | Marketing effectiveness | (Conversions ÷ Visitors) × 100 | Identifies sales funnel performance |
Operating Cash Flow | Liquidity strength | Cash from Operations | Safeguards against financial risks |
NPS | Customer satisfaction & loyalty | Promoters – Detractors | Reflects customer advocacy |
Real-World Example: Why KPIs Make a Difference
Take the case of Amazon. The reason its model works really isn’t just about the size and the scale, but this laser focus on KPIs around customer satisfaction, time to delivery, retention.
By closely tracking and optimizing these numbers, Amazon crafted a customer-centric model that encourages repeat purchases from anywhere in the world.
Similarly, companies with smaller businesses can use KPIs to achieve maximum return on marketing investment, maximum service quality and continued growth.
Key Statistics on KPI Usage
At the same time research says that companies with strong KPIs are 2.5 times more likely to achieve top financial performance as compared to their peers (Source: Harvard Business Review).
Tracking financial KPIs (cash flow and profit margins) decreases the insolvency risk of small and mid-size businesses (SMBs) by as much as 30% (Source: Forbes).
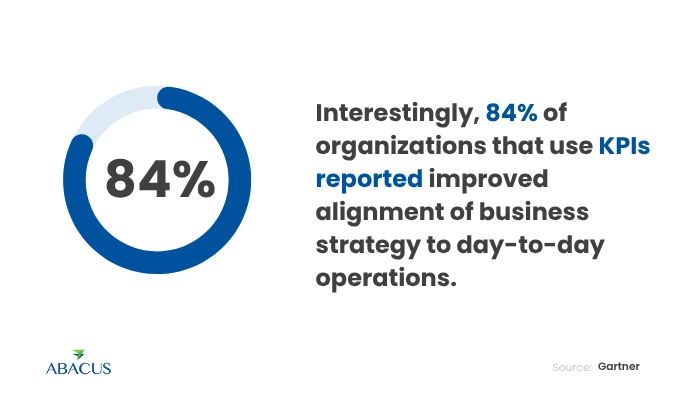
Interestingly, 84% of organizations that use KPIs reported improved alignment of business strategy to day-to-day operations (Source: Gartner).
Conclusion
However, tracking the right KPIs is a map and the compass to growth, profitability, and customer satisfaction.
As trends in these KPIs seem to be pointing towards the business world or the other, they aid the customer to chime in to take action either way (like reducing the offers on services or a surge in their plans).
With these top 10 KPI examples, whether you are a growing startup or a Fortune 500 company, your strategy can leverage them to optimize the way you are making decisions.
And, in 2025 and the years beyond, those businesses that make the right calls on how to measure will be the businesses that are able to scale sustainably.