On this page
Most US enterprise contact centers are measuring the wrong things - or measuring the right things against benchmarks that expired three years ago.
The stakes are real. The US contact center software market alone hit $77.82 billion in 2026, and with 80% of contact centers now deploying AI in some form, the performance baselines your team inherited from 2022 are no longer adequate guides for decision-making. If your operations team is still optimizing purely for Average Handle Time or chasing the old 80/20 service level rule without question, you're likely optimizing for efficiency at the expense of outcomes your customers - and your CFO - actually care about.
This guide walks through the contact center KPIs that matter most for US enterprise operations in 2026: what they measure, what "good" actually looks like right now, and where teams most often go wrong tracking them.
Why Your KPI Framework Needs a 2026 Reset
There's a fundamental shift happening in how top-performing contact centers define success. Speed metrics dominated the last decade. Resolution and effort metrics are defining this one.
Here's what's forcing the reset for US enterprises specifically:
- AI is rewriting volume baselines. McKinsey data cited across multiple 2026 benchmark reports suggests AI-augmented operations are reducing total interaction volume by 40–50%. When half your contacts don't reach a human agent, human-only KPI averages look artificially good - or bad - depending on what's left in the queue.
- Customer patience is shorter than benchmarks assume. Over 60% of US callers abandon a call after just two minutes on hold. Yet many enterprise SLA frameworks still treat 40-second answer speeds as aspirational.
- Cost per contact has bifurcated. Human-assisted interactions now average $13.50 per contact (Gartner), while AI self-service runs around $1.84. A blended cost per contact number masks this gap entirely, making investment decisions harder to justify.
The solution isn't to throw out your existing dashboard. It's to audit which metrics are still causally connected to customer outcomes - and which ones have become vanity numbers.
The 7 Contact Center KPIs That Actually Drive Enterprise Performance
1. First Contact Resolution (FCR)
FCR remains the single most consequential metric in a contact center. It measures the percentage of customer issues fully resolved in one interaction — no callbacks, no follow-ups, no escalations.
- Why it matters more now: Every unresolved contact creates a repeat contact, which multiplies cost and erodes satisfaction simultaneously. At the enterprise level, a 1% improvement in FCR can translate to hundreds of thousands of dollars in avoided contacts annually across large US operations.
- 2026 benchmark: 70–85% industry range. Top-performing human teams hit the upper end. AI-augmented operations are pushing FCR above 85% on eligible ticket types — because, unlike human agents, AI doesn't skip troubleshooting steps on a Friday afternoon.
- Common mistake: Measuring FCR only on inbound calls. In omnichannel environments — email, chat, social — FCR is harder to track but equally important. A customer who resolves via chat should count; one who follows up via email 24 hours later should not.
2. Customer Satisfaction Score (CSAT)
CSAT measures how satisfied customers were with a specific interaction, typically gathered via a post-contact survey. For US enterprise contact centers, this is often the KPI most closely watched by the C-suite and client-side stakeholders.
- 2026 benchmark: 85%+ for top-performing centers. Industry average sits closer to 75–80%. Note that CSAT survey response rates have declined industry-wide, which means low-response programs often capture only the most vocal customers — skewing scores either direction.
- What most teams miss: CSAT without accompanying verbatim analysis tells you how people feel but not why. US enterprise teams that pair CSAT scores with AI-driven sentiment tagging on call transcripts get 3–5x more actionable insight from the same data.
3. Average Handle Time (AHT)
AHT measures total interaction time: talk time, hold time, and after-call work (ACW). It's one of the oldest contact center KPIs and still one of the most misused.
- 2026 benchmark: 6 minutes and 10 seconds is the current industry average across voice interactions. But context matters enormously — a healthcare contact center handling insurance queries has a legitimately higher AHT than a telco resolving simple account inquiries.
4. Average Speed of Answer (ASA) and Service Level
ASA measures how long a customer waits before an agent picks up. Service Level (often the 80/20 rule - 80% of calls answered within 20 seconds) gives a performance target.
- 2026 benchmark: ASA of 20–30 seconds is the accepted benchmark for enterprise voice channels. Top-performing centers using AI-driven routing are pushing well beyond the traditional 80/20 standard.
- The real risk today: With AI self-service absorbing a larger share of routine contacts, the interactions reaching human queues skew toward complex, high-emotion issues. An ASA that looks healthy on paper may be masking an understaffed queue of genuinely difficult contacts.
5. Customer Effort Score (CES)
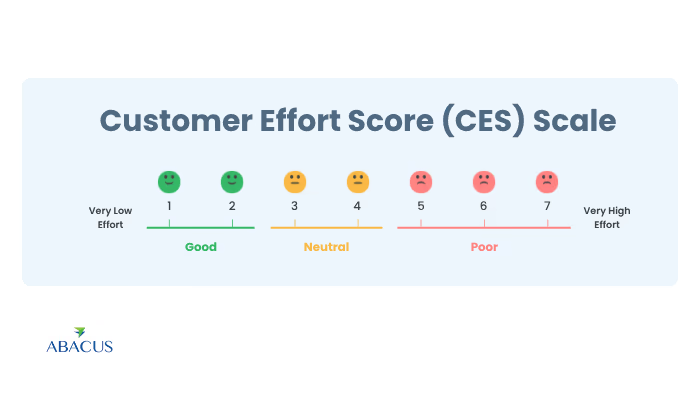
CES asks customers a simple question: "How easy was it to resolve your issue today?" It's a leading indicator of churn in a way that CSAT often isn't - customers can be satisfied with an agent while still finding the overall experience exhausting.
- Why US enterprises should prioritize this: In B2B contact center environments - particularly for financial services, healthcare, and SaaS - CES predicts contract renewals and Net Promoter Score movement more reliably than CSAT alone. A Fortune 500 healthcare company that reduced its CES friction by one point across its member services line saw a measurable uptick in plan renewal rates in the following quarter.
- 2026 trend: CES is increasingly measured at the journey level, not just the contact level - tracking effort across all touchpoints before a customer reaches a live agent.
6. Agent Occupancy and Schedule Adherence
Occupancy measures the percentage of time agents spend on active contact-related work versus idle time. Schedule adherence tracks how closely agents follow their planned schedules.
- 2026 benchmarks: Voice occupancy: 75–85%. Schedule adherence: 85–92%. These numbers have held relatively steady - they're fundamentally workforce management metrics, not AI-disrupted ones.
- The hidden risk at the high end: Occupancy above 85% consistently correlates with agent burnout and higher turnover. US contact center agent attrition rates already run 30–45% annually at many large-scale operations. Pushing occupancy targets without monitoring agent wellness metrics is a retention risk masquerading as an efficiency win.
7. Cost Per Contact
Cost per contact divides the total operational cost by the number of contacts handled in a given period. In 2026, this KPI has become significantly more complex - and significantly more important - as AI creates a two-tiered cost structure.
- What smart teams are doing: Rather than tracking a single blended cost per contact, leading US enterprises now report cost per contact separately by channel and resolution type - giving leadership a clearer view of where outsourcing or automation investments will generate the most ROI.
2026 Contact Center KPI Benchmarks: Quick Reference
Use this table to compare your current performance against current industry standards. Sources include Gartner, Nextiva, Lorikeet (March 2026) and CloudTalk benchmark data.
|
KPI |
Industry Average (2026) |
Top Performer Target |
AI-Augmented Target |
Source |
|
First Contact Resolution (FCR) |
70–79% |
80–85% |
85%+ |
|
|
Average Handle Time (AHT) |
6 min 10 sec |
Under 5 min (simple contacts) |
Context-dependent |
|
|
Average Speed of Answer (ASA) |
28 seconds |
20 seconds or less |
Under 10 seconds (AI routing) |
|
|
CSAT Score |
75–80% |
85%+ |
85%+ with AI coaching |
|
|
Agent Occupancy Rate |
75–85% |
80–85% (with wellness monitoring) |
Shifts with AI volume absorption |
|
|
Schedule Adherence |
85–92% |
90–92% |
No change |
|
|
Call Abandonment Rate |
5–8% |
Under 5% |
Under 3% with AI deflection |
The Metric Most US Enterprises Are Still Ignoring: AI Resolution Quality
Here's a number that doesn't appear on most legacy contact center dashboards: AI quality score — a measure of whether AI-resolved contacts were actually resolved correctly, not just closed quickly.
As AI handles a growing percentage of contacts, a new failure mode has emerged: AI closing tickets without genuinely resolving the underlying issue. This shows up as a delayed repeat contact rate spike — often 2–3 weeks after AI deployment — that traditional FCR measurement misses entirely because the first contact was logged as resolved.
By 2027, service leaders expect AI to handle roughly half of all contact center interactions. For US enterprises deploying or scaling AI in customer service, tracking AI resolution quality alongside traditional KPIs isn't optional — it's the difference between a cost reduction and a customer experience disaster.
Turning KPI Data Into a Contact Center You Can Actually Scale
Tracking these metrics is the straightforward part. The harder work is building the operational systems — staffing models, QA frameworks, escalation paths — that move performance from industry average to top-quartile, consistently, at enterprise scale.
US enterprises that outsource contact center operations to a specialist BPO partner get something harder to measure than any KPI: institutional expertise in building those systems from day one, rather than years into a performance improvement cycle.
At Abacus BPO, we run contact center programs for US enterprise clients with real-time KPI dashboards, SLA-backed performance commitments, and AI-augmented agent support designed around the 2026 benchmark landscape — not 2022. Learn more about our contact center outsourcing services or get in touch to discuss your specific KPI targets.