On this page
- What Is Regression Analysis?
- Why Regression Analysis Matters More in 2026
- The Main Types of Regression Analysis Used in Business
- How to Read Regression Output: The Metrics That Matter
- Where Regression Analysis Is Applied in BPO and Contact Center Operations
- Regression Analysis vs. Other Analytical Methods: Choosing the Right Tool
- The Prerequisites for Reliable Regression Modeling
- How Abacus BPO Uses Regression Analysis in Client Programs
- The Bottom Line
Every business question that starts with the word "predict" eventually leads to the same place: regression analysis.
How many calls will our contact center receive next quarter? Which factors are driving our customer churn rate up? What is the relationship between agent handle time and customer satisfaction scores? Does increasing training hours reliably improve quality assurance scores, and by how much?
None of those questions can be answered with a bar chart or a summary average. They require a method that identifies relationships between variables, quantifies the strength of those relationships, and produces a reliable model for predicting future outcomes. That is precisely what regression analysis delivers.
Businesses can use regression analysis to improve nearly every aspect of their operations. Used correctly, it is a powerful tool for learning how adjusting variables can improve outcomes.
At Abacus BPO, regression analysis sits inside performance forecasting, campaign modeling, staffing optimization, and quality improvement programs. This guide covers what it is, the types that matter most in business contexts, how to interpret the output correctly, and where it fits inside a mature BPO analytics operation.
What Is Regression Analysis?
Regression analysis is a statistical method that predicts and explains how different factors, the independent variables, influence a specific outcome, the dependent variable. It helps build a formula that estimates an outcome from measurable input variables, and the same logic lets you predict and analyze trends in any dataset.

The two categories of variables matter in every regression model:
Dependent variable: The outcome being predicted or explained. In a contact center context, this might be average handle time, customer satisfaction score, first-contact resolution rate, or monthly call volume.
Independent variables: The factors being tested as potential drivers of that outcome. These might include agent experience level, call reason category, time of day, channel type, or number of prior contacts.
The whole objective of regression analysis is to make use of collected data and turn it into actionable insights. With the help of regression analysis, there is no guesswork or hunch-based decision-making. Data-driven decisions improve the output that the organization provides.
It is worth being clear about what regression analysis does not do. It identifies and quantifies relationships between variables. It does not, on its own, prove causation. A strong statistical relationship between two variables means they move together in a predictable way. It does not automatically mean one is causing the other. Reaching that conclusion requires domain knowledge and sound experimental design, not just a high R-squared value.
Why Regression Analysis Matters More in 2026
The business case for regression-based forecasting has become harder to ignore. 87% of enterprises missed revenue targets in 2025. Most of them had forecasts. The forecasts were wrong. The issue is not a lack of data. It is the quality and method of analysis applied to that data.
Regression analysis is the first step toward truly data-driven forecasting because it tells you which variables matter, not which variables you think matter.
The operational implications of that distinction are significant. Sales teams that forecast based on pipeline stage alone consistently underestimate the impact of variables like deal size, number of stakeholders, and time spent in the proposal stage. Contact centers that report only average handle time without modeling its relationship to first-contact resolution and CSAT scores are managing symptoms without understanding causes. Regression analysis is what bridges that gap.
Predictive analytics uses regression analysis, predictive modeling, and other statistical methods to generate insights that support critical business applications such as sales forecasting, demand and business planning, and risk management.
The Main Types of Regression Analysis Used in Business
Not all regression models are built for the same type of question. Using the wrong model for the wrong data type produces unreliable results, even when the underlying data is clean. Here is a breakdown of the types most relevant to business and BPO operations.
Simple Linear Regression
Simple linear regression models the relationship between one independent variable and one dependent variable. The output is a straight-line equation of the form:
Y = a + bX + error
Where Y is the dependent variable, X is the independent variable, a is the intercept, and b is the slope coefficient showing how much Y changes for each unit change in X.
Simple linear regression is best for forecasting when the relationship between variables is simple, proportional, and approximately straight-line, for situations where one main factor drives the outcome, or for creating easy-to-explain, quick baseline forecasts.
In a contact center context, simple linear regression might model the relationship between the number of agents on shift and total calls handled per hour, or between a specific training program duration and post-training QA scores.
Multiple Linear Regression
Multiple regression extends the simple model to include two or more independent variables simultaneously. This is the standard model for most real business forecasting problems because outcomes rarely depend on a single factor.
A company wanting to predict employee performance based on various factors such as education level, years of experience, and training hours can use multiple linear regression to identify which factors contribute the most to employee performance and make data-driven decisions regarding hiring, training, and performance improvement initiatives.
In BPO operations, multiple regression is used to model call volume forecasts that incorporate day of week, campaign activity, seasonal patterns, and product launch timing simultaneously, rather than treating each factor in isolation.
Logistic Regression
Logistic regression is used when the outcome is categorical, such as whether a loan is approved or not. The key difference from linear regression is that linear regression is used when the output is a continuous value, while logistic regression is used when the outcome is categorical.
Logistic regression is essentially used to calculate or predict the probability of a binary yes/no event occurring.
In business applications, logistic regression is used for customer churn prediction (will this customer leave or stay?), lead qualification scoring (will this prospect convert or not?), fraud detection (is this transaction legitimate or fraudulent?), and escalation probability modeling (is this call likely to escalate or resolve at first contact?).
Polynomial and Nonlinear Regression
Sometimes two variables do not follow a straight-line relationship. Nonlinear regression is used when the relationship is not linear, capturing complex patterns such as curves, saturation points, or diminishing returns that linear models cannot represent.
In operational analytics, nonlinear models are relevant when modeling the relationship between staffing levels and service quality, where returns plateau after a certain threshold, or when modeling customer satisfaction as a function of wait time, where the impact accelerates nonlinearly as wait times exceed tolerance thresholds.
Ridge and Lasso Regression
Both are advanced variations used when the dataset contains many independent variables that are correlated with each other, a condition called multicollinearity that can destabilize standard linear regression coefficients.
Ridge regression reduces the impact of less important variables without eliminating them entirely. Lasso regression goes further by driving the coefficients of the least important variables all the way to zero, effectively performing feature selection automatically. Both are useful when building models from large operational datasets with many potential predictors.
How to Read Regression Output: The Metrics That Matter
Running a regression model produces a set of statistical outputs. Knowing how to interpret them determines whether the model is trusted appropriately or misread in ways that lead to poor decisions.
| Output Metric | What It Measures | How to Interpret It in Business |
|---|---|---|
| Coefficient (b) | The change in the dependent variable for each one-unit increase in the independent variable | A coefficient of 2.4 on training hours means each additional training hour is associated with a 2.4-unit increase in the outcome variable |
| R-squared | The proportion of variance in the outcome explained by the model | 0.72 means the model explains 72% of the variation in the outcome; closer to 1.0 is better |
| Adjusted R-squared | R-squared adjusted for the number of predictors in the model | More reliable than R-squared when comparing models with different numbers of variables |
| P-value (per variable) | The probability that a variable's coefficient is zero, meaning it has no real effect | P-value below 0.05 indicates the variable is a statistically significant predictor |
| Standard Error | The average distance between predicted values and actual values | Lower standard error means predictions are closer to reality |
| F-statistic | Tests whether the overall model is statistically significant | A significant F-statistic confirms that at least one predictor is meaningfully related to the outcome |
| Confidence Interval | The range within which the true coefficient likely falls | Wide intervals signal uncertainty in the estimate; narrow intervals signal reliability |
| Residuals | The difference between predicted and actual values for each observation | Randomly distributed residuals indicate a well-fitting model; patterns in residuals signal problems |
Regression coefficients indicate the strength and direction of the relationship between the predictor variables and the outcome variable. The sign of the coefficient reveals whether there is a positive or negative relationship, while the magnitude tells you how strongly the predictor influences the outcome.
Where Regression Analysis Is Applied in BPO and Contact Center Operations
In a call center, we can analyze the relationship between wait times of callers and number of complaints using regression analysis. Data-driven decision making eliminates guesswork, hypothesis, and corporate politics from decision making. This improves business performance by highlighting the areas that have the maximum impact on operational efficiency and revenues.
The applications in contact center and BPO operations are broader than that example suggests. Here is how regression analysis maps to common operational challenges:
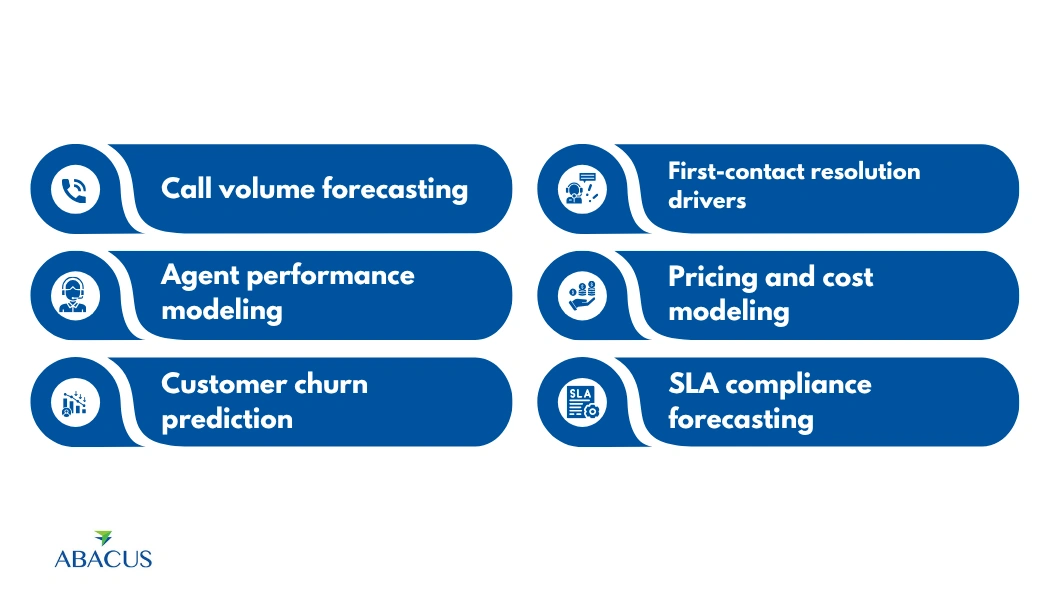
Call volume forecasting. Multiple regression models incorporating historical volume, campaign schedules, seasonality factors, and external events produce significantly more accurate staffing forecasts than simple trend projection alone. One multinational consumer goods company implemented detailed regression analysis to predict market demand and achieved enhanced forecasting accuracy by over 20%, adopted dynamic pricing strategies based on predictive outcomes, and realized streamlined operations resulting in significant cost efficiencies.
Agent performance modeling. Multiple regression identifies which factors, including tenure, call type, channel, shift timing, and coaching frequency, have the strongest and most consistent relationship with QA scores and CSAT outcomes. This shifts performance management from intuition to evidence.
Customer churn prediction. Logistic regression models built on interaction history, resolution rates, sentiment data, and contact frequency produce churn probability scores for each customer segment. These scores allow retention programs to be targeted at the customers most at risk rather than applied uniformly across all accounts.
First-contact resolution drivers. Regression analysis across call records identifies which variables, agent experience level, call reason category, IVR path taken, time in queue, or prior contact history, most strongly predict whether an issue resolves on first contact. This information directly informs training priorities and process redesign decisions.
Pricing and cost modeling. Regression analysis is often used in sales forecasting, product and service development, predicting future market trends, and maximizing profits by making adjustments to resources and marketing strategies based on forecasted market trends.
SLA compliance forecasting. Regression models built on staffing ratios, call complexity distributions, and channel volumes allow operations teams to forecast SLA compliance before a period begins rather than discovering breaches after the fact.
Regression Analysis vs. Other Analytical Methods: Choosing the Right Tool
Regression analysis is powerful, but it is one tool among several. Choosing it over alternatives, or alongside them, depends on what the data looks like and what question is being asked.
| Question Type | Best Method | Why Regression Fits (or Does Not) |
|---|---|---|
| What happened and how does it compare? | Descriptive statistics (mean, median, standard deviation) | Regression is not needed; descriptive summaries are sufficient |
| Is this difference statistically real or random? | Hypothesis testing, t-tests, chi-square | Regression can supplement but is not the primary tool for significance testing |
| What will happen next, given past patterns? | Linear or multiple regression, time series models | Regression is ideal when relationships between variables drive the forecast |
| Which of two or more groups will an observation belong to? | Logistic regression, classification models | Logistic regression is the appropriate regression type for categorical outcomes |
| What is driving a complex outcome with many correlated predictors? | Ridge, Lasso, or multiple regression | Advanced regression handles multicollinearity that simpler models cannot |
| What is the probability of a specific event? | Logistic regression, Bayesian models | Logistic regression outputs probabilities directly |
| What are the relationships across many variables simultaneously? | Multiple regression, factor analysis | Multiple regression maps multiple drivers to a single outcome efficiently |
The Prerequisites for Reliable Regression Modeling
A regression model is only as reliable as the data and assumptions behind it. There are four conditions that need to be met for a linear regression model to produce trustworthy results:
Linearity. The relationship between the independent variables and the dependent variable should be approximately linear. Visualizing the data before modeling is the fastest way to check this.
Independence of observations. Each data point should be independent of the others. In contact center data, this means treating each call record as an independent observation rather than grouping all calls from the same customer as if they were equivalent.
Homoscedasticity. The variance of the residuals (prediction errors) should remain roughly constant across all levels of the independent variables. A pattern where errors grow larger as the predicted value increases signals a model that needs adjustment.
Normality of residuals. The residuals should be approximately normally distributed. This matters most when the model is being used for inference (interpreting coefficients and p-values) rather than pure prediction.
Beyond these statistical assumptions, data quality is the most important practical prerequisite. Data quality is crucial. Comprehensive and clean data improves model reliability. Models must be revisited and updated with new data to maintain accuracy.
Stale data, missing values, and uncleaned outliers produce regression coefficients that look precise but are systematically biased. In operational analytics, this means treating data preparation as at least as important as model selection.
How Abacus BPO Uses Regression Analysis in Client Programs
Regression analysis is not a theoretical exercise at Abacus BPO. It is applied throughout the performance management and reporting cycles across client programs. In practice, this means:
Demand and volume forecasting. Multiple regression models built on historical call patterns, campaign schedules, and seasonal variables produce staffing forecasts that allow client programs to hit service level targets without chronic over or understaffing.
Performance driver identification. When a client's QA scores or CSAT metrics need improvement, regression analysis identifies which operational variables, not which assumptions, are actually driving the outcome. This prevents the common mistake of addressing the most visible symptom rather than the most statistically influential cause.
Churn and retention modeling. For clients running retention or customer success programs, logistic regression on interaction history and satisfaction data produces customer-level churn probability scores that focus outreach effort where it generates the highest return.
Training effectiveness measurement. Before and after regression modeling of QA and CSAT data confirms whether a training intervention produced a statistically and practically significant improvement, or whether observed gains fall within normal score variability.
SLA forecasting. Regression models built on staffing inputs, volume distributions, and channel mix help operations teams predict SLA compliance for upcoming periods and flag resource gaps before they become breaches.
Regression analysis helps businesses understand their data and gain insights into their operations. Business analysts use regression analysis extensively to make strategic business decisions. At Abacus BPO, that is applied specifically to the operational data that client programs generate, so that performance reporting reflects genuine understanding of what is driving results rather than a surface-level summary of what happened.
The Bottom Line
Regression analysis is a powerful tool for learning how adjusting variables can improve outcomes, and businesses can use it to improve nearly every aspect of their operations.
But it is not a black box that produces automatic answers. It is a structured method for examining the relationships inside operational data, quantifying what matters, and building forecasts that are grounded in evidence rather than assumption.
For any organization running significant volumes of operational activity, whether a contact center, a sales function, or a back-office program, the value of regression analysis lies in replacing the question "what does this number look like?" with the far more useful question: "what is actually driving this outcome, and what will happen if we change it?"
That shift from description to prediction to optimization is what distinguishes a mature analytics operation from one that simply reports what has already happened.