On this page
Most businesses have a revenue leak; they are not fully accounting for. It is not in their acquisition budget, their product costs, or their operations. It sits quietly in the gap between the customers they win and the customers they keep.
That gap has a name which is churn rate.
U.S. businesses lose $168 billion per year to customer churn. Customer acquisition costs have climbed 40 to 60 percent since 2023, driven by ad competition and attribution headwinds, while retention costs grew only roughly 12 percent over the same period. The financial case for reducing churn has never been stronger, and yet only 18 percent of companies focus more on retention than acquisition, despite retention being up to six times cheaper.
Understanding churn rate is not just a metric exercise. It is a window into the health of every customer relationship a business has. At Abacus BPO, churn analysis and retention strategy sit inside the customer experience programs we run for clients across BPO, SaaS, IT services, and contact center operations. This guide covers everything a business needs to know: the definition, the formula, the benchmarks by industry, the causes, and the strategies that actually reduce it.
What Is Churn Rate?
Churn rate is the percentage of customers who stop doing business with a company over a defined period of time. It is also called customer attrition rate, customer turnover rate, or simply customer churn.
The period can be monthly, quarterly, or annual depending on the business model. Subscription businesses typically track monthly churn because revenue cycles are short and changes compound quickly. Enterprise B2B businesses with annual contracts often track annual logo churn and annual revenue churn as their primary signals.
A high churn rate can point to product or satisfaction issues, while a high retention rate signals loyalty and strong product-market fit. Tracking both metrics helps balance acquisition, reduce revenue churn, and sustain growth.
Churn rate and customer retention rate are inverse measures of the same underlying reality:
- Churn rate = the percentage of customers lost in a period
- Retention rate = the percentage of customers kept in a period
They always sum to 100 percent. A monthly churn rate of 3.5 percent means a monthly retention rate of 96.5 percent. A 10 percent annual churn rate means 90 percent annual retention. The choice of which one to report is partly a convention by industry, but both numbers need to be visible when managing a customer base.
How to Calculate Churn Rate: The Formula
The standard churn rate formula is straightforward:
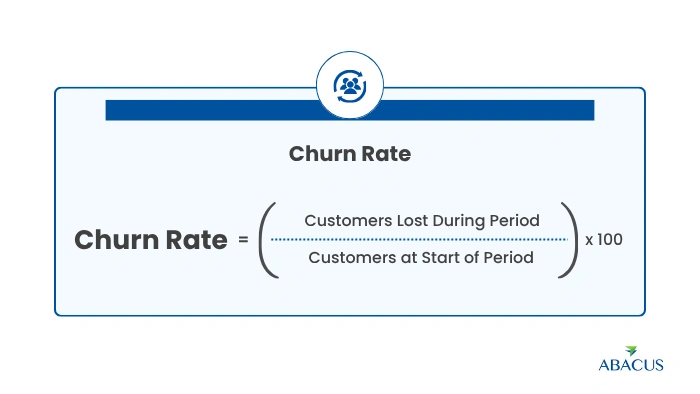
Churn Rate = (Customers Lost During Period / Customers at Start of Period) x 100
Example: A company starts the month with 1,200 customers. During the month, 42 customers cancel or do not renew.
Churn Rate = (42 / 1,200) x 100 = 3.5% monthly churn
For annual churn:
A company starts the year with 5,000 customers. During the year, 650 customers leave.
Churn Rate = (650 / 5,000) x 100 = 13% annual churn
Two important variations deserve attention:
Revenue Churn Rate measures the percentage of recurring revenue lost, rather than the percentage of customers lost. This is more important than logo churn for businesses with significant variation in customer size, since losing three small accounts may matter less than losing one large one.
Revenue Churn Rate = (MRR Lost During Period / MRR at Start of Period) x 100
Net Revenue Retention (NRR) accounts for both lost revenue from churned customers and added revenue from existing customers who expand, upsell, or buy additional services. An NRR above 100 percent means revenue from the existing customer base is growing even without counting new customer acquisition.
Median Net Revenue Retention across B2B SaaS sits at 106 percent, with top performers exceeding 120 percent. This above-100 percent retention enables growth from existing customers even while losing some accounts, fundamentally changing growth economics.
Churn Rate Benchmarks by Industry in 2026
Churn rate varies considerably by industry, business model, and customer segment. Comparing your rate against a generic average produces misleading conclusions. The meaningful benchmark is the one that reflects your specific market and contract structure.
| Segment or Industry | Monthly Churn Rate | Annual Churn Rate | Notes |
|---|---|---|---|
| B2B SaaS (median, all segments) | 3.5% | ~37% compounded | Recurly data, 2026 |
| Enterprise SaaS | 0.5% to 1.0% | 6% to 12% | Long contracts, deep integrations reduce attrition |
| Mid-market SaaS | 1.0% to 2.5% | 11% to 26% | Budget cycles drive higher voluntary churn |
| SMB/self-serve SaaS | 3.0% to 7.0% | 31% to 58% | High volume, lower switching costs |
| Infrastructure SaaS | ~1.8% | ~20% | Lowest churn among SaaS sub-categories |
| EdTech SaaS | ~9.6% | Up to 68% compounded | Highest churn in the SaaS category |
| IT and managed services | Not reported monthly | 15% to 17% annual | Higher stickiness from embedded client relationships |
| Financial services / Fintech | Not reported monthly | ~26% annual | High-churn segment due to competitive alternatives |
| SaaS and subscription (retention programs) | Not applicable | 85% to 95% retained | Reflects companies with active retention programs |
| Traditional ecommerce | Not applicable | 70% to 75% lost annually | Inherently low loyalty without subscription mechanics |
Sources: Recurly Churn Report 2026, Koji.so SaaS Benchmarks 2026, SerpSculpt B2B Retention Statistics 2026, Gitnux B2B Customer Retention Statistics 2026
The median monthly B2B SaaS churn rate in 2026 is approximately 3.5 percent, but the benchmark that matters depends entirely on who you sell to. Healthy monthly logo churn runs under 0.5 percent for enterprise, 0.5 to 1.5 percent for mid-market, and 2 to 4 percent for SMB and prosumer products, with best-in-class companies holding revenue churn below 1 percent.
The Two Types of Churn Rate Every Business Needs to Track
Not all customer exits look the same, and the category of churn determines which solution is appropriate. Applying a retention program to involuntary churn or a billing fix to voluntary churn produces no results, because the cause and the cure are completely mismatched.
Voluntary Churn
Voluntary churn occurs when a customer actively decides to stop using a product or service. They cancel, do not renew, or switch to a competitor. This type of churn reflects a failure somewhere in the product, service, or relationship: misaligned expectations, poor onboarding, inadequate support quality, insufficient perceived value, or a competitor offering a better fit.
B2B voluntary churn sits between 8 and 12 percent annually, largely linked to poor onboarding. Churn peaks at 30 percent within the first 6 months after a sale closes.
68 percent of B2B churn stems from poor relationship management, and 42 percent of B2B customers churn due to inadequate support response.
These two statistics have a direct operational implication: the quality of post-sale support and the consistency of relationship management are the largest drivers of voluntary churn in B2B environments. Both are areas where a well-structured contact center or customer success program directly moves the needle.
Involuntary Churn
Involuntary churn occurs when a customer exits not because they chose to leave, but because of a billing failure: an expired card, a failed payment, a technical processing error. The customer intended to stay.
20 to 40 percent of total churn is involuntary. Subscription businesses lose $440 billion a year to failed payments, most of it from customers who intended to stay. 85 percent of failed payments are recoverable with fast follow-up.
Involuntary churn is often the fastest and most overlooked improvement available. It does not require a product change, a service redesign, or an NPS improvement program. It requires better billing infrastructure: automated retry logic, card-updater flows, proactive dunning communications, and fast human follow-up when automated recovery fails.
Why a High Churn Rate Is More Damaging Than It Appears
The headline churn percentage understates the actual business impact for one important reason: compounding. A 3.5 percent monthly churn rate does not compound to 42 percent annually. It compounds to approximately 37 percent annually because each month's loss reduces the base from which the next month's percentage is calculated. Conversely, small improvements in churn rate compound into large financial improvements over time.
Research from Bain and Company found that a 5 percent improvement in customer retention can increase profits by 25 to 95 percent.
Reducing annual churn by just 5 percentage points can increase a company's enterprise value by 30 to 50 percent over five years, according to McKinsey research.
There is also the acquisition cost dimension. Every customer who churns does not just take their subscription revenue with them. They take the acquisition cost already spent to win them. Acquiring a new customer costs 5 to 7 times more than retaining an existing one. A high retention rate reduces customer acquisition costs, increases lifetime value, and fuels word-of-mouth growth.
And there is a lifetime value dimension on top of that. A repeat customer is 60 to 70 percent likely to buy again, whereas a new prospect has only a 5 to 20 percent chance of converting. Customers who stick around spend roughly 67 percent more than first-time buyers.
The combined effect of acquisition cost, compounding revenue loss, reduced lifetime value, and lost referral potential means that a business with a 5 percent annual churn rate and a 10 percent annual churn rate is not running similar businesses with one slightly different number. They are on fundamentally different growth trajectories.
The Root Causes of High Churn Rate in B2B Operations
Understanding why customers leave is a prerequisite for reducing the rate at which they do. The causes of voluntary churn in B2B environments are well documented and remarkably consistent across industries.
Poor onboarding. 40 to 60 percent of users who churn do so within the first 90 days, with the highest drop-off in days 1 to 30. Customers who do not reach a clear point of value quickly lose confidence that they ever will.
Inadequate support quality. 42 percent of B2B customers churn due to inadequate support response. This is not about resolution quality alone. It is about response speed, consistency across channels, and the ability to resolve issues without requiring repeated contacts.
Poor relationship management. 68 percent of B2B churn stems from poor relationship management. In practical terms, this means customers who feel like a ticket number rather than an account, who cannot reach a consistent point of contact, or who receive no proactive outreach between renewal discussions.
Disengagement signals ignored. 73 percent of customers who churn show disengagement signals 30 to 90 days before canceling, but only if you are watching. Product usage data, support contact frequency, response times to outreach, and NPS trajectory all produce early warning signs that retention programs can act on. Organizations not monitoring these signals consistently are reacting to churn after it has already occurred.
Misaligned value perception. When customers no longer see the connection between what they pay and what they receive, churn follows. This is particularly common in B2B when the champion who originally purchased a service moves on and a new stakeholder inherits an account without context for its value.
How to Reduce Churn Rate: Strategies That Work in 2026
Reducing churn is a multi-layered problem. No single tactic addresses all of its causes simultaneously. The most effective retention programs address onboarding, support quality, relationship management, early warning monitoring, and billing recovery in parallel.
Compress time to first value. Companies with strong onboarding, specifically time-to-first-value under 7 days, see 50 percent lower churn rates. The first weeks of a customer relationship determine how that customer mentally frames the product for the rest of their contract.
Build early warning systems. Churn rarely arrives without signals. Customer health scoring models, built on usage frequency, support contact rate, NPS trajectory, and engagement metrics, allow customer success teams to intervene before a customer has already made their decision to leave.
Invest in support quality as a retention lever. Customers receiving excellent service show 87 percent retention versus 41 percent for those receiving poor service. That 46-percentage-point gap in retention attributable to service quality represents the clearest possible argument for investing in contact center performance rather than treating it as a cost line.
Create consistent relationship touchpoints. Quarterly business reviews, proactive check-ins, and usage-based outreach all sustain the relationship between renewal cycles. Customers who hear from their provider only when a renewal is due are the ones most likely to evaluate alternatives.
Fix involuntary churn first. Because the majority of payment failures are recoverable with fast follow-up, addressing involuntary churn is typically the fastest return-on-investment improvement available. 85 percent of failed payments are recoverable with fast follow-up and a clean card update flow.
Use behavioral analytics to personalize retention. Product usage data drives 15 percent retention improvements. Companies leveraging behavioral analytics and engagement metrics consistently outperform those relying on relationship management alone.
Segment retention efforts by customer risk. Not all at-risk customers have the same value or the same reason for leaving. Directing high-touch retention effort toward high-value accounts and using automated outreach for lower-value segments maximizes the return on retention investment.

How Churn Rate Connects to Contact Center and BPO Performance
The link between contact center operations and churn rate is direct, and it runs through two of the most consistently cited causes of voluntary churn: support quality and relationship management.
Reducing time-to-resolution in support is the most efficient lever for consumer brands where support quality drives churn decisions.
In practice, the contact center metrics that correlate most strongly with churn outcomes are:
- First-contact resolution (FCR): Customers who resolve issues on first contact are significantly less likely to churn than those who require multiple contacts. Each additional contact a customer must make to resolve the same issue increases their likelihood of evaluating alternatives.
- Average handle time and hold time: Extended wait times and long call durations signal poor operational efficiency to customers who are already evaluating their options.
- CSAT and NPS trends: Both metrics function as early warning signals. A declining trend in either metric often precedes a spike in churn by 30 to 60 days in B2B service environments.
- Escalation rate: High escalation frequency relative to peers is a leading indicator of service quality gaps that are already generating the relationship dissatisfaction that drives churn.
For clients running outsourced customer service programs through Abacus BPO, churn rate reduction is not a background objective. It is built into the performance design of the program from the beginning: FCR targets, response time standards, proactive outreach cadences, and health scoring all align toward the same outcome of keeping the customers already won.
Churn Rate at a Glance: Key Formulas and Metrics
| Metric | Formula | What It Tells You |
|---|---|---|
| Customer Churn Rate | (Lost Customers / Starting Customers) x 100 | Percentage of customer base lost in a period |
| Revenue Churn Rate | (MRR Lost / Starting MRR) x 100 | Percentage of recurring revenue lost in a period |
| Net Revenue Retention (NRR) | ((Starting MRR + Expansion - Churn) / Starting MRR) x 100 | Whether revenue from existing customers is growing or shrinking |
| Customer Retention Rate | 100 minus Churn Rate | The inverse of churn; percentage of customers kept |
| Customer Lifetime Value (CLV) | Average Revenue per Customer / Churn Rate | Estimated total revenue from an average customer over their lifetime |
| Churn-to-Acquisition Ratio | Churned Customers / New Customers Acquired | Shows whether growth is genuinely net positive or being masked by acquisition volume |
| Time to First Value (TTFV) | Days from sign-up to first meaningful product use | Onboarding speed; strongly correlated with early-stage churn prevention |
The Bottom Line
Churn rate is not just a metric on a dashboard. It is the signal that tells a business whether its product, service, and customer relationships are strong enough to hold customers past the point of acquisition.
The businesses with the strongest retention in 2026 are not simply the ones with the best product or the lowest price. They are the ones that invest in support quality, build proactive relationship management into their operations, monitor disengagement signals before customers decide to leave, and treat every contact their customers make as an opportunity to build loyalty rather than close a ticket.
Reducing churn by even a few percentage points compounds into a fundamentally different growth curve. Understanding what is driving it, and acting on those drivers with the right retention strategies, is one of the highest-return investments a business can make.
Frequently Asked Questions
What is a good churn rate for a B2B company?
It depends heavily on your segment. The gold standard for mature enterprise SaaS companies is 5 to 7 percent annual churn, meaning 93 to 95 percent retention. For the overall B2B SaaS market, 10 to 15 percent annual churn is considered healthy and sustainable. The more useful benchmark is the one specific to your segment: enterprise, mid-market, or SMB, and your industry vertical.
What is the difference between churn rate and retention rate?
They are two ways of measuring the same thing from opposite directions. If your monthly churn rate is 4 percent, your monthly retention rate is 96 percent. Churn rate tells you the rate of loss; retention rate tells you the rate of loyalty. Both are needed for a complete picture.
What is involuntary churn and how is it different from voluntary churn?
Voluntary churn is when a customer actively decides to leave. Involuntary churn is when a customer exits because of a billing failure, such as an expired card or a failed payment, despite intending to stay. 20 to 40 percent of total churn is involuntary, and 85 percent of failed payments are recoverable with fast follow-up.
How does churn rate affect customer lifetime value?
Customer lifetime value is directly calculated from churn rate: a lower churn rate means customers stay longer, and longer-staying customers are more valuable in total revenue, referral generation, and expansion potential. Cutting churn rate in half roughly doubles the average customer lifetime.
How does contact center performance affect churn rate?
Significantly. Support quality, first-contact resolution, and response consistency are among the top cited causes of B2B customer churn. Customers receiving excellent service show 87 percent retention versus 41 percent for those receiving poor service.
Can a small change in churn rate really have a large business impact?
Yes. A 5 percent improvement in customer retention can increase profits by 25 to 95 percent, according to Bain and Company research. Because of the compounding effect of monthly churn and the layered value of longer customer relationships, even modest improvements in churn rate translate into substantial long-term revenue differences.